Full Disclosure: I am a researcher in Georgia Tech's ISTC-ARSA, which is funded by Intel. Although I reference two publications that share Xinyang Ge and Weidong Cui as authors, I am neither associated with them nor Microsoft Research at the time of writing.
Intel Processor Trace (PT) is a powerful hardware feature for recording the behavior of CPUs. With it, developers and researchers can monitor the control-flow path taken by threads, hardware interrupts, and more, all with cycle-accurate timing. However, this rich stream of data comes at the cost of size. Depending on what PT is configured to trace, it can output hundreds of megabytes of data per second per core. PT does take steps to save bandwidth by only recording changes in control-flow, excluding redundant high-order bits in target addresses, and compressing returns leading to predictable locations. However, despite this compression, the volume of data is still massive.
As a consequence, much of the work published so far handles tracing in one of two ways. One option is to consume the trace as it is generated. This works as long as the consumer can keep up with the producer, which is the case in the control-flow integrity (CFI) system Griffin. The other common approach is to configure PT to write in a circular buffer. This option is suitable for crash dump analysis systems like Snorlax, which only need a fixed size window into a thread's past.
However, while some applications are feasible using the two previous methods, there are still situations were it is desirable to store the entire trace for postmortem analysis. If nothing else, it is useful for repeatable experiments. With this in mind, I performed a naive experiment last night to explore if more can be done to compress PT traces when the data is at rest. Based on the observations that the compression PT applies is highly localized (i.e. a target address verses the previously recorded target address and a return verses the previously recorded call) and that programs often execute repetitive loops, I hypothesized that even a general purpose compression algorithm should be able to compress traces with a good ratio.
Procedure
The overall idea for the experiment is very simple: gather some PT traces,
compress them with a commonly used algorithm, and compare the sizes.
For a subject I used the simple HTTP server that comes with Python 2.7 to host
a copy of this blog. For each trial I had a crawler request pages from the
server for a set duration. Once the time expired, I terminated the server and
crawler and stopped the tracing. I then compressed the trace using the GNU/Linux
utility gzip, which uses Lempel-Ziv coding. I also fed it through a
disassembler that matches the PT packets to the binary's static code to
produce a linear sequence of instructions. From this I counted the number of
unique basic blocks executed during the trace to serve as a rough proxy for code
coverage. To summarize the procedure:
- Configure and enable PT tracing.
- Start the Python HTTP server.
- Start the crawler.
- Wait for a specified duration.
- Terminate the crawler and server.
- Stop PT tracing.
- Compress the resulting trace and count the number of unique basic blocks executed.
Results

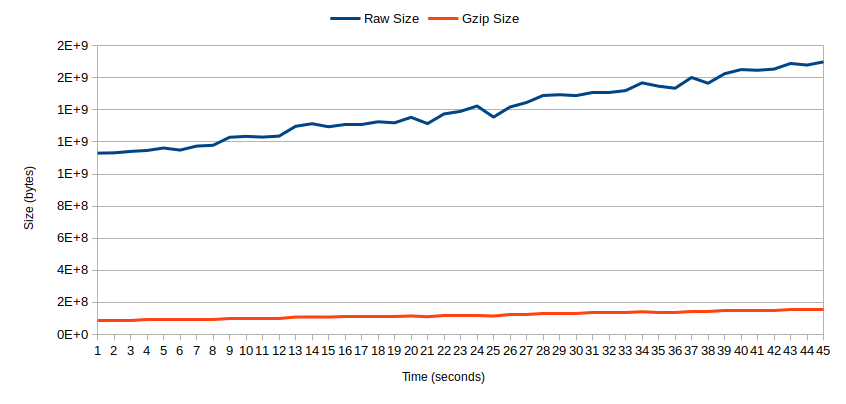
Comparing the original size of the PT trace to the size after compression produces the above graph. Both plots best match linear regressions and are increasing over time. However, the size of the compressed traces increases at a slower rate than the uncompressed traces, meaning these two plots are diverging as time increases.
Another observation to note is the large volume of trace data produced during the server's startup. This explains why even the shortest trial produced a 1GB trace. For the same reason, counting the number of unique basic blocks turned out to not be useful. The number of new basic blocks executed while serving requests was small.

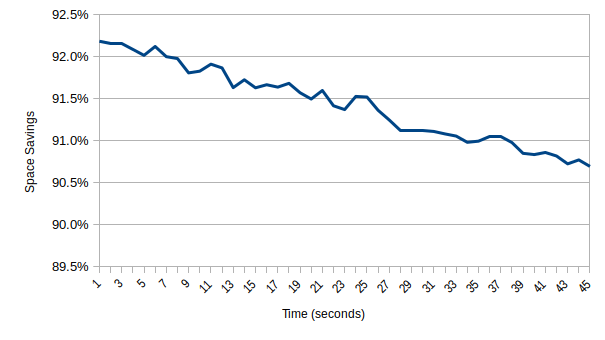
The next graph shows the relationship between the compressed and uncompressed sizes as a space savings percentage. The plot best fits a linear regression and shows the savings decreasing over time. This is likely due to the design of the underlying compression algorithm, which is intended for general use and does not take into consideration the unique characteristics of PT traces.
To summarize, this experiment shows that more can be done to compress PT traces for storage at rest.
Discussion
It is understandable that the compression used by PT would produce small space savings compared to general compression algorithms given the limitations of hardware memory and Intel's very strict performance overhead requirements. In practice, PT produces an overhead of less than 4% in the worst case, and less than 2% on average. These numbers are based on my own observations and the results published by other researchers. In short, PT has very few clock cycles and very little space available for performing compression.
Another factor that deserves consideration is compression's impact on processing time. For systems that consume PT traces on the fly, the largest source of performance overhead is not PT tracing itself but rather the time spent buffering and consuming it. In CFI, for example, the PT trace has to be matched with the executed code in order to reconstruct control-flow. This is why the authors of Griffin report a 11.9% overhead on the SPECint benchmark despite the 4% overhead of PT itself. Adding better space saving compression could increase this overhead further.
That said, for storing PT traces at rest, more can be done to better conserve space.
